Hi, it's me Vardaan

I am a Final-Year CSE Undergrad from VIT Bhopal University

About Me

Vardaan IMAGE

My name is Vardaan. I am currently enrolled in VIT Bhopal University as a final-year student, pursuing Computer Science Engineering. I undertook this domain out of my curiousity and interest in computers and how they function. Over the years at my university, I have had the privelege to study and explore various fields like Computer Vision, Data Analytics, Web-Dev etc.

  • Name: Vardaan Vishnu
  • Age: 21
  • Occupation: Upcoming intern @ PwC India

I have been part of various team projects, wherein we focused on solving real-world problems. Apart from academics, I was a Core-Member of Meraki, the Fine-Arts club of my university, and had organised various cultural events too. I was also a Tech-Columnist for The Frontier Vedette. In my free-time, I love to watch movies and read books.
Coursework Undertaken

C/C++

Studied 'Fundamentals of Programming & C' under Prof. Manikandan K. during Fall-Semester 2019-20 and 'Programming in C++' under Dr. Pon Harshavardhanan during Winter-Semester 2019-20. The courses focused on introducing us to programming concepts.

Operating Systems

Studied 'Operating Systems' under Dr. Ashwin M. during Winter-Semester 2020-21. The course focused on introducing students to OS fundamentals, Processes, Threads, Scheduling, Deadlocks etc.

Computer Networks

Studied 'Computer Networks' under Dr. Gaurav Soni during Winter-Semester 2021-22. The course focused on networking terminologies, devices, topologies and OSI model of networking.

Internet & Web Programming

Studied 'Internet & Web Programming' under Dr. J. Subash Chandra Bose during Winter-Semester 2021-22. The course focused on introducing us to concepts of Internet and basics of HTML and CSS.

Fundamentals of Data Science

Studied 'Fundamentals of Data Science' under Dr. Lakshmi during Fall-Semester 2021-22. The course focused on introducing us to concepts of R Programming and introduction to Data Science field.

Software Engineering

Studied 'Software Engineering' under Dr. Priyanka during Winter-Semester 2020-21. The course focused on introducing students to concepts of SDLC and development workflows.

Project Work

Card image

Anon Web

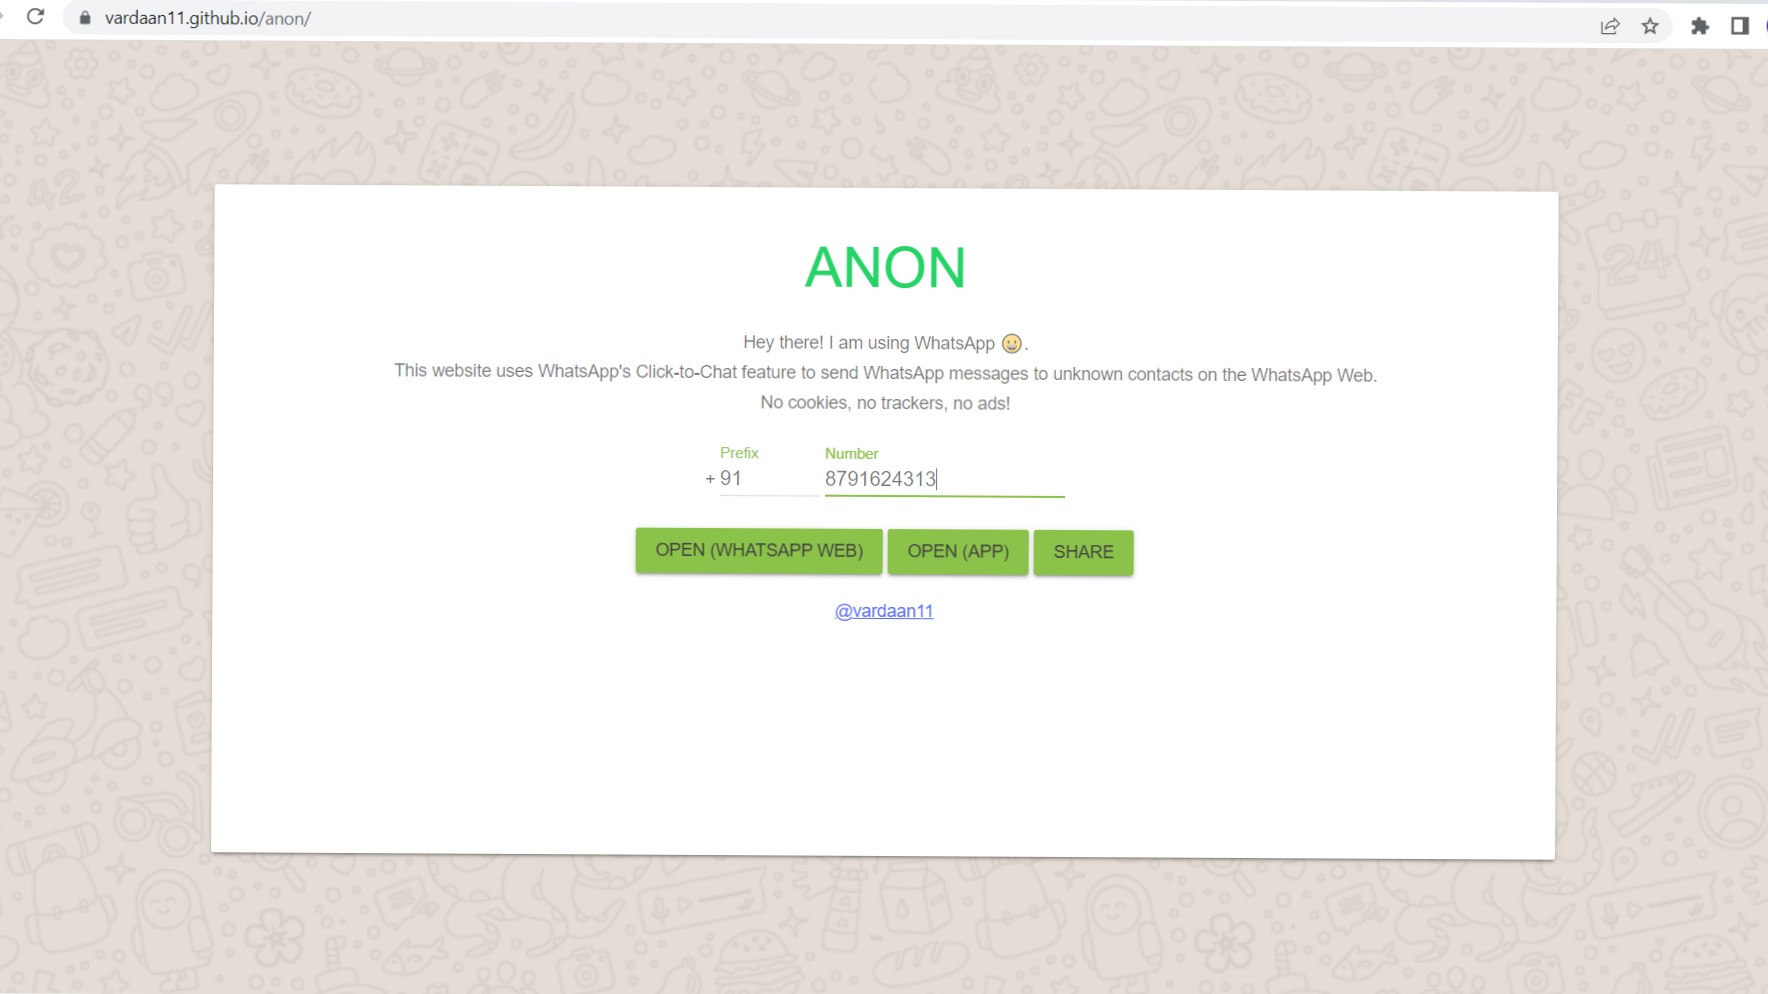
It aims to facilitate WhatsApp Messaging to unknown contacts on WhatsApp Web.

Card image

Doori

It is a Social Distancing Tracker, made for Crowd Management during Covid-19 pandemic.

Card image

Real-Time Flight Data Visualisation

R-app that visualises flight data of Air-France Airlines in real-time.


Card image

Faceoff

It is a Face Detection Model that was built using OpenCV and Streamlit.

Card image

Sentiment Analysis

Sentiment Analysis of the EMMA novel by Jane Austen using R and Natural Language Processing.

Card image

Drug Data Analysis | TCS iON

TCS iON internship - Analysis and modelling of classifiers to detect the side effects of a Drug.

Anon Web

Anon Web aims to be a kind of app that will facilitate WhatsApp Messaging and WhatsApp Calling without having to save the recipients contact information. This idea originates from people’s need for quick messaging to unknown contacts, on the go! The app makes work through using public WhatsApp API links available, that can be modified to contact any number that is registered as an active user on the platform.

  1. Type the number country code of the contact whom you want to chat with,through WhatsApp Web.
  2. Type the contact number you want to chat/call through WhatsApp Web.
  3. WhatsApp public API is called in the application.
  4. Server systems do the backend message routing.
  5. You are then redirected to your chat with that person.

It has a variety of use-cases like, we students can send any assignment or tutorial related work to anyone without saving the number as our app is meant for these purposes only. When WhatsApp will start digital transfer of money, then we can transfer money without saving the contact info, for faster transactions. Though, it comes with its own shortcomings like, people might misuse it for spamming unknown contacts.

Doori

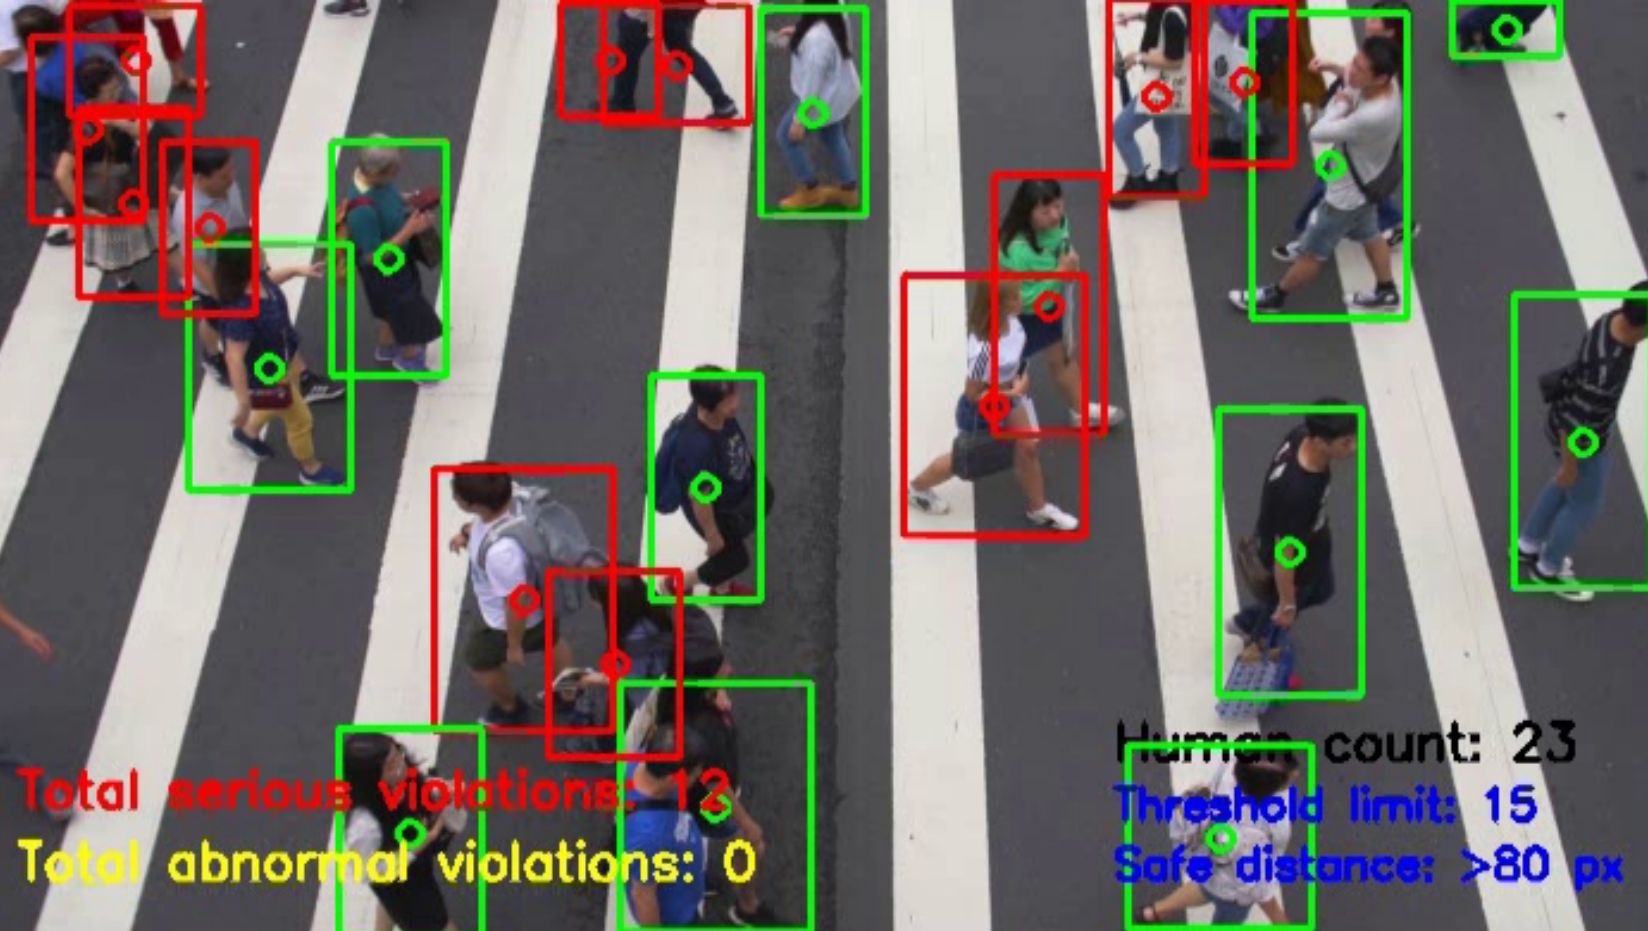
In 2020-21, when the Covid-19 situation was at its peak, it was very important to maintain social distancing in public places. The safety measures taken by the governments around the world had failed in front of the deadly second wave of Covid-19, due to lack of social distancing practice. Newer variants of the virus had and keep on emerging, that are equivalent or more dangerous than the previous one. Thus, it becomes a monumental challenge to tackle the issue of social distancing in an overly populated country like India. Hence, me and my team, under the guidance of our guide Dr. Abha Trivedi came forward with our project, Doori, a social distancing tracker, based on Computer Vision. Our project’s main objective is to help authorities implement social-distancing in public places & offices.

  1. Get the input video/frame.
  2. Apply Human Detection to detect all the people in the given image/frame.
  3. Create bounding boxes for these detections.
  4. Get the centroid of the boxes.
  5. Compute the pairwise distances between centroids of all detected people.
  6. Based on these distances, check to see if any two people are less than threshold (N) pixels apart.
  7. Loop the entire process for all consequent frames.

Thus, we can conclude here that Doori Social distancing tracker is functional and can detect objects with 72% confidence score. It uses OpenCV, DNN and the application modules can also be used for various thresholds. We hope that Doori helps the world and reaches out to more and more people/organizations.

Real-Time Flight Data Visualization

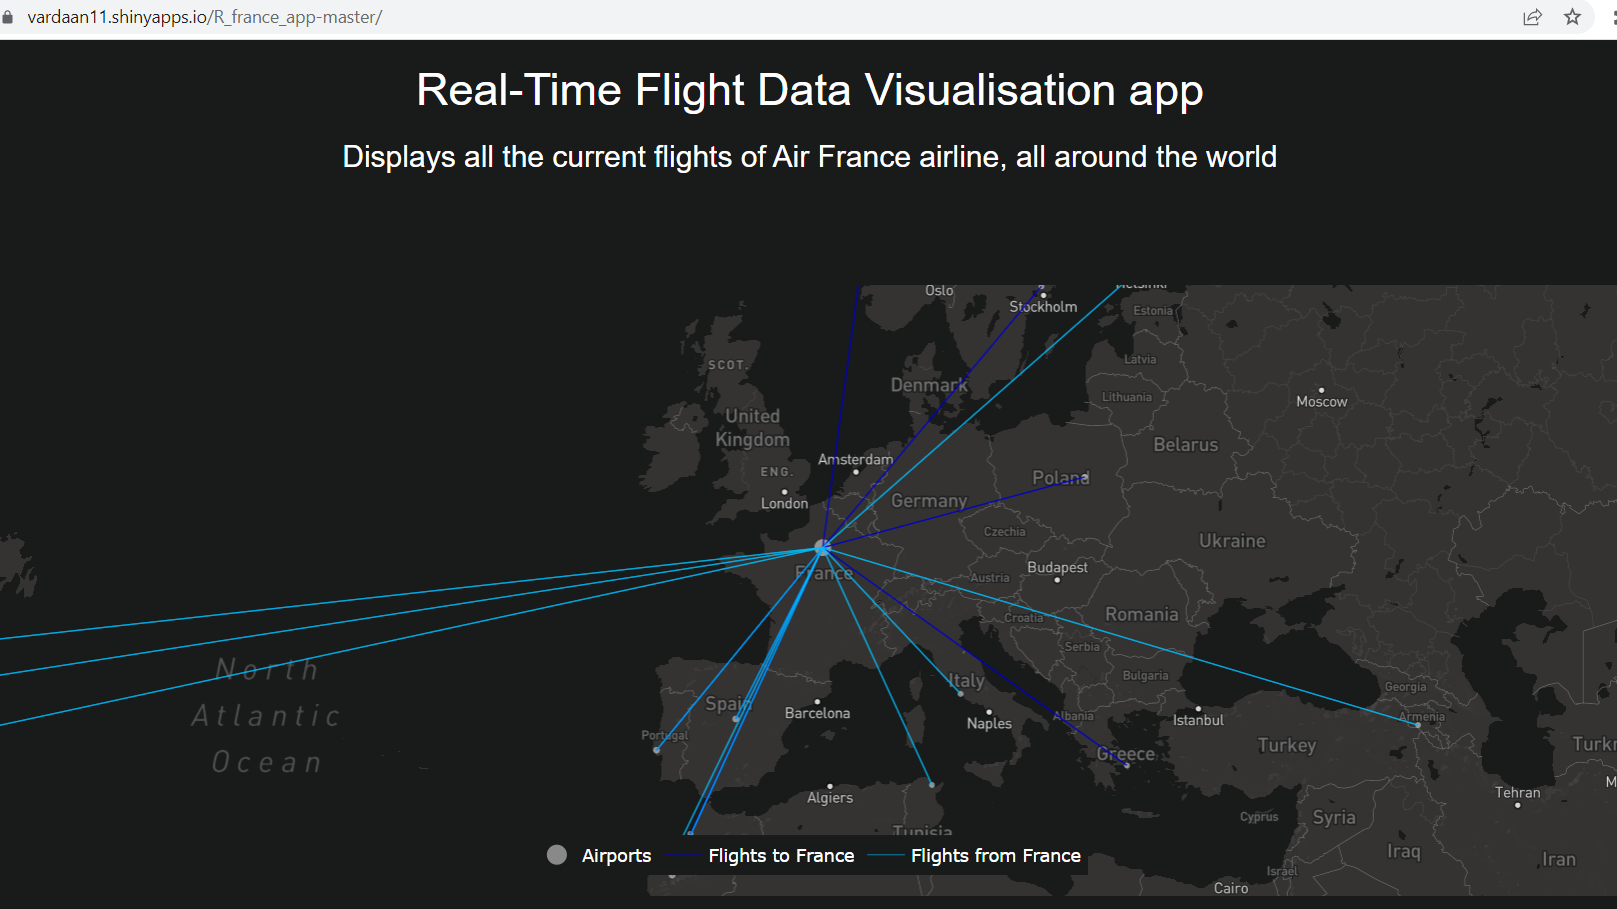
This project is mainly a fully functional and user-friendly web application, that uses web scrapping to get live data of Air France flights. The flights are plotted on a reactive map with a color distinction according to their provenance/destination. The concerned airports are also plotted and differentiated by size according to frequentation. The live flights data are taken from flightaware.com. Once the airline url obtained, the data is displayed in a table but limited to 20 rows per page. From the scrapped Data, some modifications where needed in order to plot what I intended to do.

  1. Create web-scrapping script for getting flight data from internet.
  2. Clean data and make a proper dataframe.
  3. Use Plotly and Mapbox libraries for making the visualization dashboard.
  4. Make use of Shiny library to create a WebApp for the R-Script.

The map is in fact a Mapbox, using Plotly. The main idea is to superimpose the various information layers, that is the map, the airports markers, and the flights segments. All that toying with available parameters to obtain a pleasant design. Every R script can be turn into a web app using shiny. Now you do not necessarily have to structure your app in several files. However, the R code must be separated in a UI and Server part. Concerning hosting environment there is a possibility to use shiny provided services, or to dockerize the app and deploy it elsewhere. I have done using the Shinyapps.io platform.

FaceOff

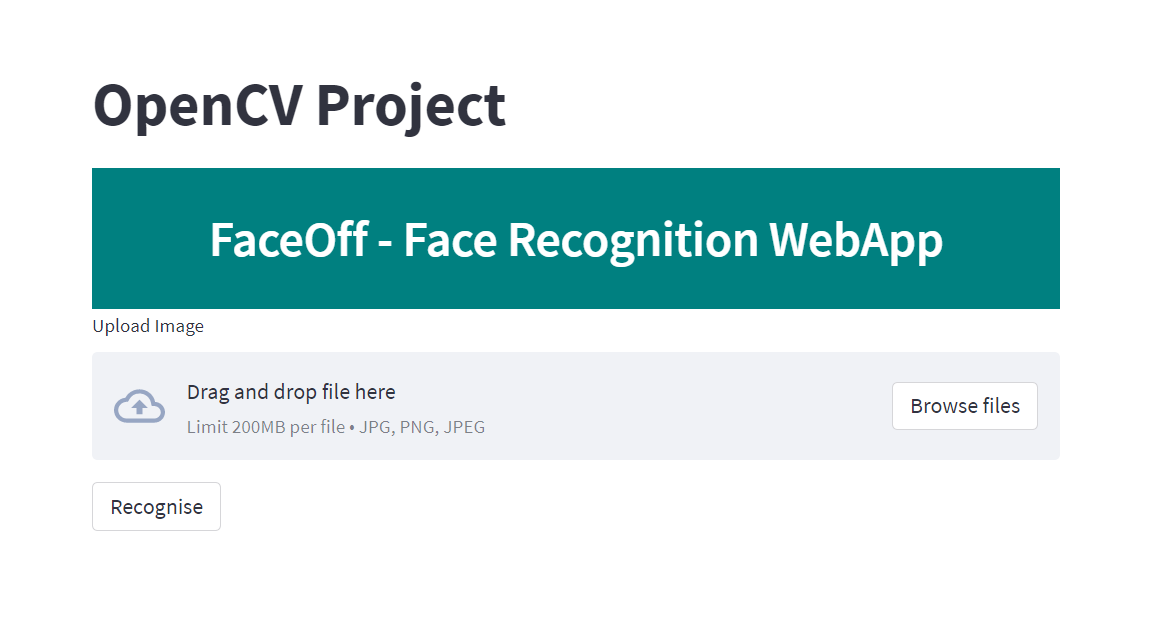
FaceOff is a Computer Vision Model that was built using OpenCV and deployed onto a Webpage using Streamlit and hosted via Heroku. As the name suggests, it does Facial Recognition and identifies people based on its own trained dataset. We start by creating a dataset of all the images. To do this, we import OpenCV library. Remember we use the OpenCV-contrib-python library as it contains all the main modules as well as the contributed/extra modules. OpenCV (OpenSource Computer Vision Library) is an open-source computer vision and machine learning software library.

  1. Create training dataset of your own images.
  2. Create a python script that can perform face detection using the HCC algorithm.
  3. Train the model based on your training dataset.
  4. Finally, we create a webapp using Streamlit and host it on Heroku.

I used the Haar-Cascade Face Classifier to detect faces in the images supplied. Haar cascades, first introduced by Viola and Jones in their seminal 2001 publication, Rapid Object Detection using a Boosted Cascade of Simple Features, are arguably OpenCV’s most popular object detection algorithm. The next step is to train the image dataset using the LBPH (Local Binary Pattern Histogram) face recognition algorithm. We finally use the Haar cascades to detect and then LBPH algorithm to recognize faces in the provided image with that to our stored data. If it matches, we get the name of the individual!

Sentiment Analysis of Jane Austen Novel

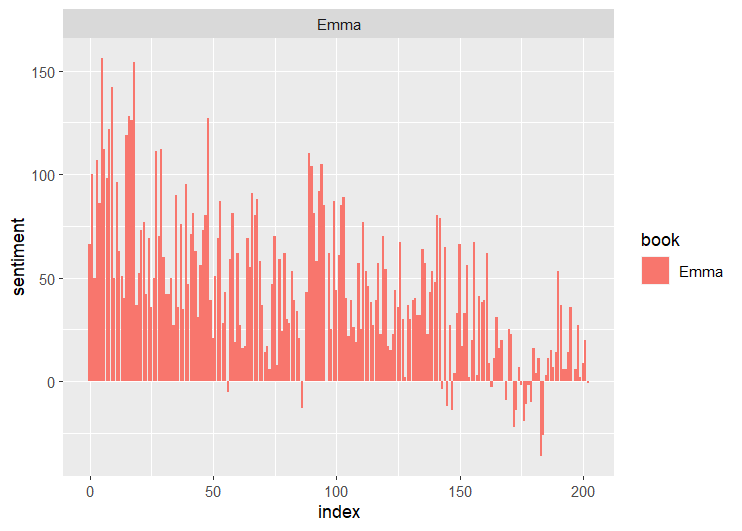
Sentiment analysis provides a way to understand the attitudes and opinions expressed in texts. In this project, we explored how to approach sentiment analysis using tidy data principles; when text data is in a tidy data structure, sentiment analysis can be implemented as an inner join. We can use sentiment analysis to understand how a narrative arc changes throughout its course or what words with emotional and opinion content are important for a particular text.

  1. Import lexicon libraries and novels.
  2. Prepare novel text in tidytext format and ready for analysis.
  3. Run an inner join between the sentiment lexicon (Bing here) and the text of the selected novel (Emma here).
  4. Now, we can plot the findings in different available ggplots like word-cloud, timeline, bar graphs etc.

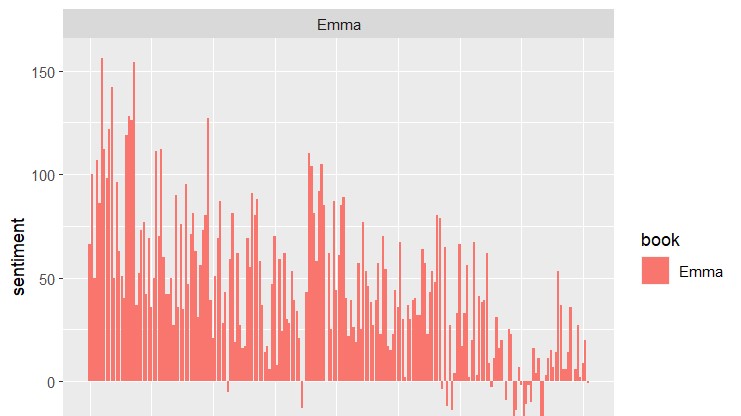
One way to analyze the sentiment of a text is to consider the text as a combination of its individual words and the sentiment content of the whole text as the sum of the sentiment content of the individual words.The tidytext package provides access to several sentiment lexicons. Three general-purpose lexicons are Afinn, Bing and NRC. All three of these lexicons are based on unigrams, i.e., single words. Next, we count how many positive and negative words there are in defined sections of each book. Now we can plot these sentiment scores across the plot trajectory of any novel.

Drug Data Analysis | TCS iON

The Purpose of this internship was to build a Classification Model. A Classification models are a subset of supervised machine learning. A classification model reads some input and generates an output that classifies the input into some category. Here we intend to use these tools to create a model that can categorize different side effects that can occur due to age, gender and race.

  1. Create a dataset. Here we use the WebMD dataset from Kaggle.
  2. Clean the dataset and sanitize it. Datasets usually contain raw and disoriented data and need to clean it and make it proper for better performance with our classification model.
  3. We pre-process the data according to our needs, so, we remove the outliers and missing values, and then use the dataset.
  4. We carry out exploratory data analysis.
  5. We Split the dataset into training and testing sets for the purpose of having different values when training our model and different values when testing it for real world.
  6. We use different algorithms to build our model so that we can gauge which one of the listed methods is best for creating our desired classification model.
  7. We have thus created our classification model and tested it too. Now we make the final analysis and the conclusion and our project is completed.

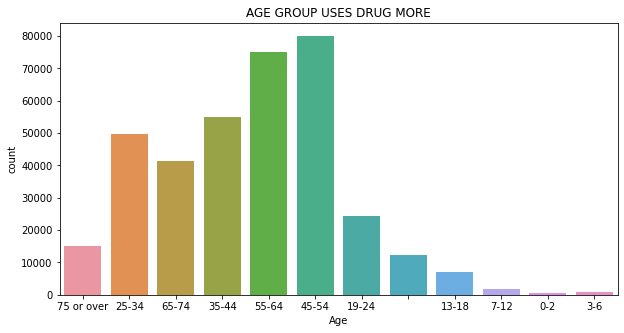
As an outcome, we have completed the importing of various libraries, cleaning and sanitizing of dataset, exploratory analysis of the dataset and further splitting of dataset into the training and testing sets. Then we created a simple classifier using logistic regression and trained it on our training set. Finally, we tested our model on the testing set and we got the accuracy of 69%.

Contact Me

https://www.embed-map.com
Email: vardaan.vishnu2019@vitbhopal.ac.in
Contact No: +91-8791624313